- By Rahul
- October 1, 2026
- No Comments
Nifty 50 Today: Pre-Market vs Actual Market Analysis – 1 October 2026
Nifty 50 Today: Pre-Market vs Actual Market Analysis – 1 October 2026
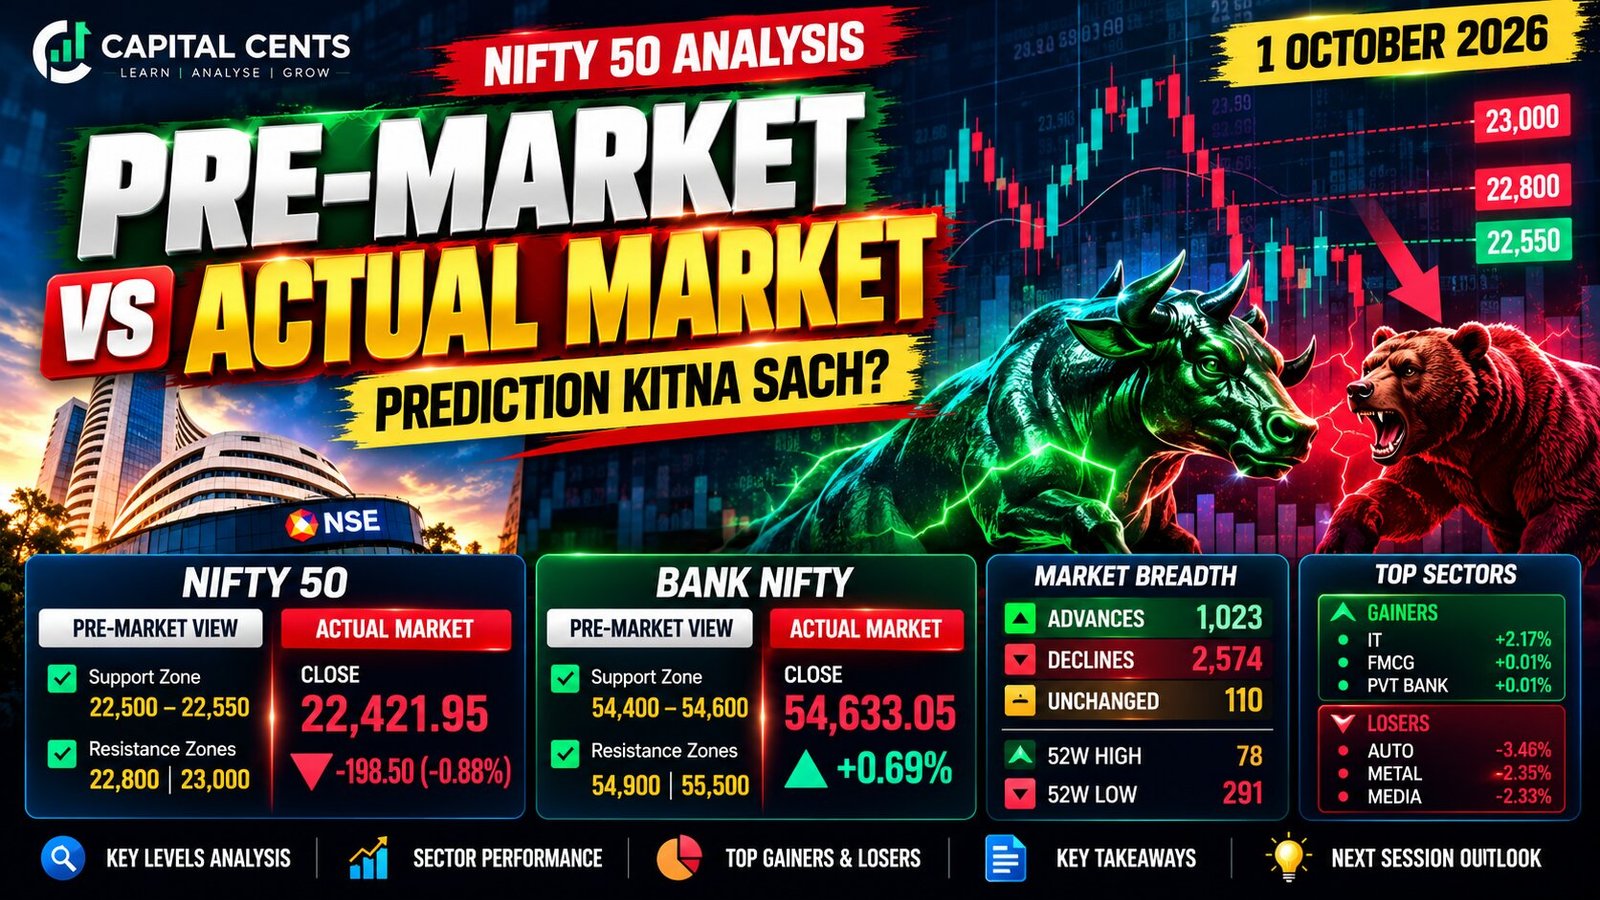
The Indian stock market witnessed a weak trading session on 1 October 2026, as the Nifty 50 closed below its previous closing level amid broad-based selling pressure. While select stocks and sectors displayed strength, the overall market breadth remained negative.
The Nifty 50 opened at 22,543.70 and closed at 22,421.95, declining by 198.50 points or approximately 0.88% compared with the previous close of 22,620.45.
In this Capital Cents market analysis, we compare the pre-market outlook with the actual market performance, examine key support and resistance levels, review sector-wise movements, and identify important observations for the next trading session.
Nifty 50 Market Summary – 1 October 2026
Here are the key Nifty 50 figures recorded during the session.
| Market Parameter | Value |
|---|---|
| Previous Close | 22,620.45 |
| Opening Level | 22,543.70 |
| Closing Level | 22,421.95 |
| Net Change | -198.50 points |
| Percentage Change | -0.88% |
| Advance-Decline Ratio | 1,023 Advances / 2,574 Declines |
The index opened below its previous close and subsequently moved lower. Although the intraday chart showed a recovery from lower levels, the Nifty 50 remained below its previous closing price at the end of the session.
This price action indicates that buyers attempted a recovery, but the rebound was not sufficient to reverse the day’s overall weakness.
Pre-Market Outlook vs Actual Market Performance
One of the most important parts of daily market analysis is comparing the levels identified before the opening bell with the actual price action.
1. Pre-Market Outlook
The pre-market framework highlighted the 22,500–22,550 region as an important support zone to monitor. The recovery zones identified for observation were 22,800 and 23,000.
These levels represented areas to watch rather than guaranteed targets or predictions of market direction.
The key questions were whether the index would sustain above the support zone, recover towards resistance, or continue lower if selling pressure persisted.
2. Actual Market Performance
The Nifty 50 opened at 22,543.70, placing the index inside the identified support zone.
However, the index did not sustain above the zone throughout the session. Selling pressure pushed prices lower, and the index eventually closed at 22,421.95.
The intraday chart also showed a move towards the 22,200 region before a partial recovery later in the session.
The important observation is that the support zone did not hold as a sustained closing area. The recovery was also insufficient to bring the index back above its previous close.
3. What Can Traders Learn From This Comparison?
A support level should not automatically be treated as a buying signal. Traders need to observe how price behaves around that area.
Important confirmation signals may include:
- Whether the index sustains above or below support.
- Whether a breakdown is followed by continued selling.
- Whether a recovery is supported by price action.
- Whether resistance levels are reclaimed.
- Whether the trade offers a suitable risk-to-reward profile.
The purpose of pre-market analysis is to prepare possible scenarios, not to guarantee the market’s next move.
Nifty 50 Support and Resistance Levels
Based on the levels identified in the pre-market framework and the subsequent price action, the following zones are relevant for continued observation.
Support Levels
22,500–22,550: This was the key support zone identified before the market opened. The index closed below this area, making its ability to reclaim the zone an important observation for the next session.
Around 22,200: The intraday chart showed the index moving towards this region before recovering. It can be monitored as a reference area, but it should not be treated as guaranteed support.
Resistance Levels
22,500–22,550: Following the close below this zone, traders can monitor whether the index reclaims it or faces selling pressure on a recovery.
22,800: This was the first major recovery zone in the pre-market framework.
23,000: This was the next higher resistance reference if a stronger recovery developed.
These are observation levels, not confirmed forecasts for the next trading session. Price action and fresh market data should guide any subsequent assessment.
Market Breadth Analysis: Selling Pressure Across Stocks
Market breadth provides additional context beyond the movement of the benchmark index.
According to the market statistics visible after the close, the session recorded the following figures:
| Market Breadth Indicator | Number of Stocks |
|---|---|
| Stocks Traded | 3,707 |
| Advances | 1,023 |
| Declines | 2,574 |
| Unchanged | 110 |
| Stocks at 52-Week High | 78 |
| Stocks at 52-Week Low | 291 |
| Stocks in Upper Circuit | 95 |
| Stocks in Lower Circuit | 199 |
The number of declining stocks was substantially higher than the number of advancing stocks. There were also more stocks at their 52-week lows than at their 52-week highs.
This indicates that market weakness extended beyond the headline index to a broad section of traded stocks.
However, market breadth alone does not determine what will happen in the next session. It should be assessed alongside price action, index structure, sector performance and other relevant information.
Sector-Wise Stock Market Performance
Sector performance was mixed, with information technology showing strength while several other sectors faced selling pressure.
Major Sector Movements
| Sector Index | Change |
|---|---|
| Nifty IT | +2.17% |
| Nifty Auto | -3.46% |
| Nifty Metal | -2.35% |
| Nifty Media | -2.33% |
| Nifty Bank | -0.33% |
| Nifty Pharma | -0.48% |
| Nifty Financial Services | -0.38% |
| Nifty FMCG | -1.61% |
Percentage changes are based on the sector figures shown in the supplied market screenshots.
Nifty IT: A Pocket of Strength
The Nifty IT index gained approximately 2.17%, making information technology a notable area of strength during the session.
Infosys also appeared among the leading gainers in the supplied market snapshot.
This divergence highlights why sector-wise analysis can be useful: even during a weak overall market, certain sectors and stocks may move in the opposite direction.
Nifty Auto: Significant Weakness
The Nifty Auto index declined approximately 3.46%, making it one of the weakest sectors in the displayed sector snapshot.
Bajaj Auto and Maruti were also among the notable losers, reflecting weakness in prominent automobile stocks during the session.
Nifty Metal and Media
Nifty Metal declined approximately 2.35%, while Nifty Media fell around 2.33%.
The weakness across these sectors added to the negative picture in the broader market.
Top Gainers and Losers on 1 October 2026
The market snapshot highlighted several stocks with notable percentage movements.
Top Gainers
| Stock | Last Traded Price | Change |
|---|---|---|
| Infosys (INFY) | ₹1,035.00 | +4.11% |
| HDFC Life (HDFCLIFE) | ₹534.20 | +2.49% |
| HDFC Bank (HDFCBANK) | ₹721.20 | +1.76% |
| SBI Life (SBILIFE) | ₹1,721.60 | +1.49% |
| Max Healthcare (MAXHEALTH) | ₹940.95 | +1.20% |
Infosys led the displayed list of gainers, followed by HDFC Life and HDFC Bank. These movements show that individual stocks can demonstrate relative strength even when the benchmark index closes lower.
Top Losers
| Stock | Last Traded Price | Change |
|---|---|---|
| Bajaj Auto (BAJAJ-AUTO) | ₹10,045.00 | -7.62% |
| Maruti Suzuki (MARUTI) | ₹11,386.00 | -4.86% |
| Shriram Finance (SHRIRAMFIN) | ₹945.00 | -3.84% |
| Tata Steel (TATASTEEL) | ₹178.00 | -3.42% |
| Adani Ports (ADANIPORTS) | ₹1,737.80 | -3.36% |
Bajaj Auto recorded the largest percentage decline among the stocks listed in the supplied snapshot. Maruti Suzuki and Shriram Finance also registered notable losses.
These figures represent the stocks displayed in the provided market snapshot and should not be interpreted as a complete ranking of every stock traded on the exchange.
What Should Traders Monitor in the Next Session?
Following a weak close, traders can focus on a few important areas when preparing the next pre-market plan.
1. Reclaiming the 22,500–22,550 Zone
The index closed below this previously identified support zone. Traders can observe whether Nifty reclaims the area and sustains above it or faces renewed selling pressure.
2. Price Behaviour Around the 22,200 Region
The intraday chart showed a move towards the 22,200 area before a recovery. Further price action around this region can be monitored, without assuming that it will necessarily hold.
3. Strength of Any Recovery
A recovery should be evaluated using price structure, follow-through and relevant confirmation signals. A brief upward move alone does not establish a sustained trend reversal.
4. Sector Rotation
Nifty IT showed relative strength, whereas Auto, Metal and Media remained weak in the supplied sector snapshot. Monitoring whether these differences persist may help traders understand the market’s changing structure.
5. Market Breadth
The balance between advancing and declining stocks can provide additional information about participation in a market move. Traders should review fresh breadth figures rather than assuming that the previous session’s pattern will continue.
These observations are a framework for market monitoring, not a directional prediction or a recommendation to enter a trade.
Key Takeaways From the 1 October 2026 Session
The trading session offered several useful lessons for market participants:
- Nifty 50 closed at 22,421.95, down 198.50 points or 0.88%.
- The index opened inside the previously identified 22,500–22,550 support zone but did not sustain above it.
- An intraday recovery developed after the index moved towards the 22,200 region, but the index still closed below its previous close.
- Market breadth was negative, with 2,574 declines against 1,023 advances.
- Nifty IT gained approximately 2.17%, while Nifty Auto, Metal and Media recorded losses.
- Support and resistance levels should be treated as areas for observation, with decisions based on confirmation and risk management.
The key lesson is that a useful pre-market plan includes multiple possible scenarios and a process for evaluating actual market behaviour. Comparing the plan with the closing data helps traders review what happened without assuming that any level or forecast guarantees a result.
Conclusion
The Indian stock market ended 1 October 2026 on a weak note, with the Nifty 50 closing at 22,421.95 after losing 198.50 points. The index opened within the 22,500–22,550 support zone identified in the pre-market framework but closed below it.
Negative market breadth and weakness in Auto, Metal and Media contrasted with gains in IT and selected stocks. These differences reinforce the importance of studying the index, individual sectors and market participation together.
For the next session, traders can monitor the 22,500–22,550 zone, the 22,200 region and the previously identified recovery levels of 22,800 and 23,000. Fresh price action and market conditions will determine how relevant these reference points remain.
Follow Capital Cents for daily stock market analysis, Nifty 50 updates, Bank Nifty analysis, technical analysis education and pre-market versus actual market reviews.
Frequently Asked Questions (FAQs)
1. What was the Nifty 50 closing value on 1 October 2026?
Nifty 50 closed at 22,421.95, down 198.50 points or approximately 0.88% from its previous close of 22,620.45.
2. What was the Nifty 50 opening level on 1 October 2026?
The index opened at 22,543.70, within the 22,500–22,550 support zone identified in the pre-market framework.
3. How did market breadth look on 1 October 2026?
The supplied market statistics showed 1,023 advancing stocks, 2,574 declining stocks and 110 unchanged stocks.
4. Which sector performed positively during the session?
Nifty IT gained approximately 2.17% in the supplied sector snapshot, while Nifty Auto, Metal and Media declined.
5. Which support and resistance levels were being monitored?
The pre-market framework highlighted 22,500–22,550 as a support zone, with 22,800 and 23,000 as recovery reference levels. The intraday chart also showed a move towards the 22,200 region.
6. Does a support breakdown guarantee further market declines?
No. A breakdown does not guarantee that prices will continue lower. Traders should evaluate follow-through, recovery attempts, market breadth and risk management before drawing conclusions.
Disclaimer: This article is intended for educational and informational purposes only. It does not constitute investment advice or a recommendation to buy or sell any security. Stock market investments are subject to market risks. Readers should conduct their own research and consult an appropriately qualified professional where necessary.