- By Rahul
- September 29, 2026
- No Comments
Nifty 50 Post-Market Analysis: September 29, 2026
Nifty 50 Post-Market Analysis: September 29, 2026
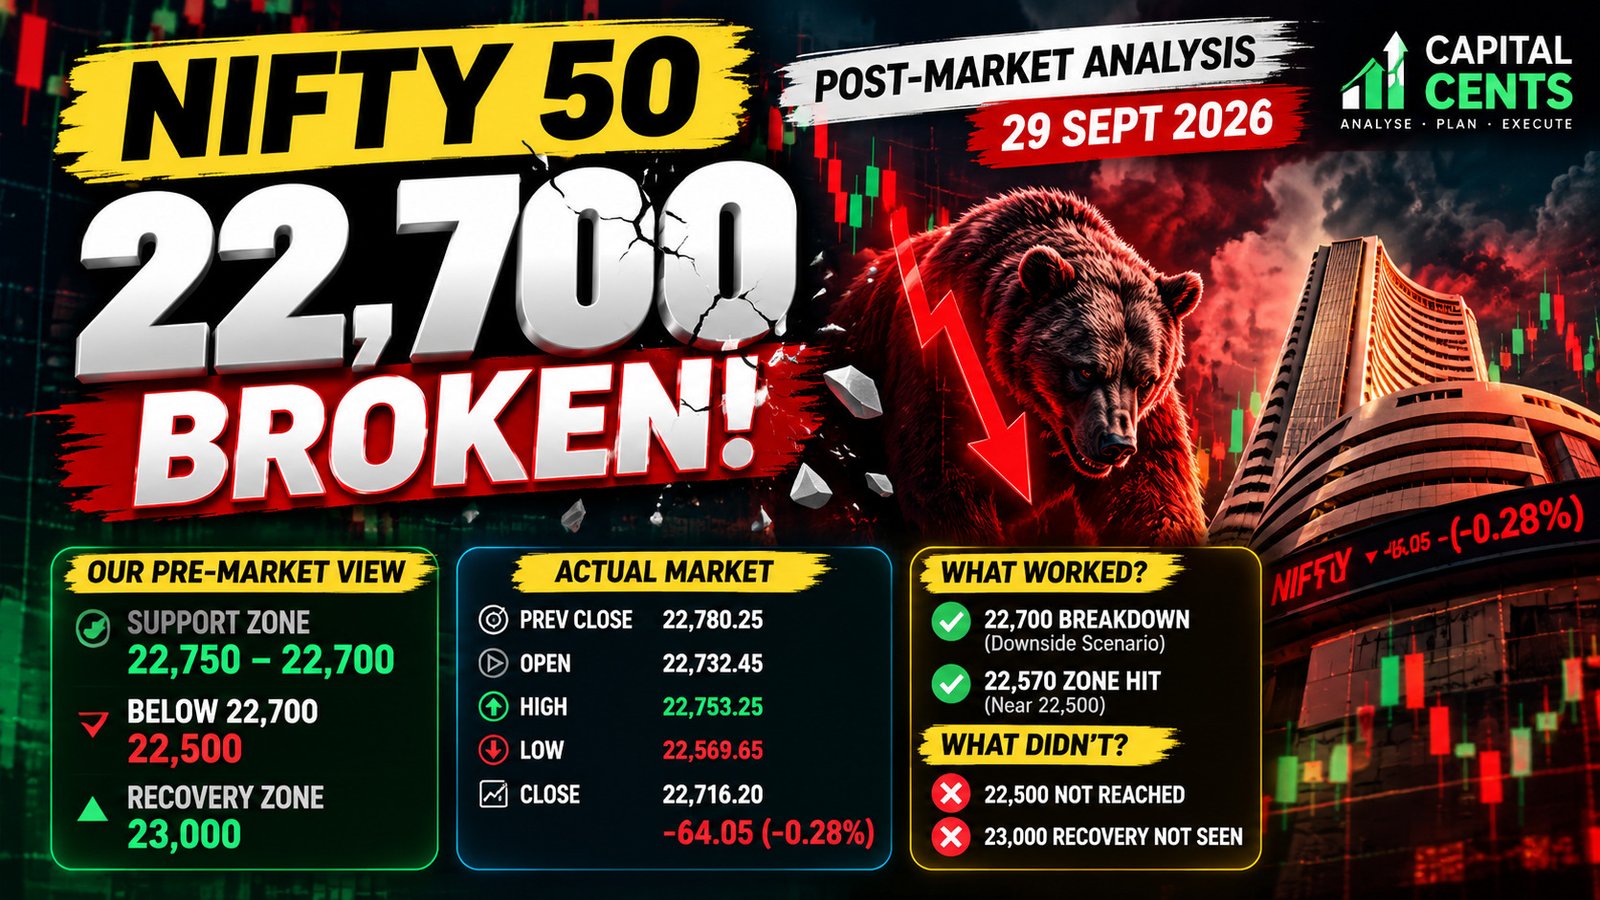
The Indian stock market witnessed further weakness in the Nifty 50 index on September 29, 2026. The index closed at 22,716.20, down 64.05 points or 0.28% from its previous close of 22,780.25.
In this post-market review, Capital Cents compares the morning trading scenarios with the actual market movement to understand which levels were tested, how the downside scenario developed, and which target remained unachieved.
Rather than focusing only on the successful part of the analysis, this review covers both the levels that worked and those that were not reached.
1. Nifty 50 Market Summary — September 29, 2026
The following figures are taken from the market screenshots provided for this analysis.
Market Parameter | Actual Data |
|---|---|
Previous Close | 22,780.25 |
Opening Level | 22,732.45 |
Closing Level | 22,716.20 |
Day’s High | 22,753.25 |
Day’s Low | 22,569.65 |
Net Change | -64.05 points |
Percentage Change | -0.28% |
The Nifty 50 opened below its previous closing level and traded within a range of approximately 183.60 points between the displayed session high and low.
The closing level remained below the previous close, reflecting a negative session overall.
2. Pre-Market Prediction vs Actual Market
The central focus of this review is whether the morning’s support and downside scenarios aligned with the actual price movement.
The morning trading plan
The setup being reviewed contained the following levels:
22,750–22,700: Important support zone.
Below 22,700: Further downside weakness to watch.
22,500: Potential extended downside level.
23,000: Recovery scenario if support held and the market strengthened.
These levels represent conditional scenarios, not guaranteed market outcomes.
3. Nifty 50 Technical Analysis: What the Chart Shows
The five-minute chart shows an initial decline, followed by a partial recovery and further fluctuations during the session.
Three observations stand out from the supplied chart data.
First, the opening was weak. Nifty opened at 22,732.45, below its previous close of 22,780.25.
Second, the downside extended beyond the key support area. The session low of 22,569.65 was significantly below 22,700, supporting the bearish direction of the scenario.
Third, the market recovered from its intraday low. Nifty closed at 22,716.20, above the day’s low but still below the previous close.
This distinction matters: an intraday breakdown does not mean the index will continue falling throughout the entire session. Price can recover even after a significant downside move.
4. Important Nifty Levels: Prediction vs Outcome
Level | Role in the Setup | Actual Outcome |
|---|---|---|
22,750–22,700 | Support zone | Broken during the session |
22,569.65 | Actual intraday low | Reached |
22,500 | Extended downside level | Not reached |
23,000 | Recovery scenario | Not reached |
The table highlights why market reviews should distinguish between directional accuracy and exact target achievement.
The bearish scenario aligned with the market’s downside movement, but the extended target was not achieved. The alternative recovery scenario also did not materialise.
5. Did the Pre-Market Prediction Work?
Based on the levels being reviewed, the bearish direction of the setup was validated by the actual market movement.
However, this single session does not establish an overall prediction accuracy percentage.
To calculate a meaningful accuracy score, a consistent evaluation method would need to define:
Whether the direction was correct.
Whether the specified support or resistance level was tested.
Whether the target was reached.
Whether the setup’s invalidation conditions occurred.
How multiple sessions are scored and aggregated.
For this session, the fair conclusion is that the downside scenario played out, while the 22,500 target remained unachieved.
At Capital Cents, reviewing missed targets alongside successful scenarios helps maintain a transparent record of market analysis.
6. Key Lessons for Traders
Understand conditional scenarios
A support level is not a guarantee that the market will reverse. A breakdown can create a different trading scenario, but confirmation remains important.
Separate direction from target accuracy
Correctly anticipating a bearish move and correctly predicting its final low are two different things. Both should be assessed separately.
Review the complete session
A useful post-market review includes the opening, intraday high and low, closing price, support and resistance levels, and whether the expected scenarios actually occurred.
Apply risk management
Technical levels are planning tools, not guarantees. Traders should consider position sizing, stop-loss placement, market volatility, and the possibility of false breakouts before entering a trade.
7. What Should Traders Watch in the Next Session?
The September 29 data provides a starting point for the next session’s analysis, but it does not determine the next market direction.
Traders can monitor the following reference levels:
22,700: A reference area for assessing whether the index can regain the previous support zone.
22,570: The approximate area of the latest intraday low.
22,500: The previously identified extended downside level.
22,780: The previous close, which may serve as a reference when assessing recovery.
These are reference levels derived from the supplied data and earlier scenario. They are not a verified forecast for the next trading session. Fresh price action and confirmation should be assessed before drawing new conclusions.
Website: www.capitalcents.in
Facebook: https://www.facebook.com/centscapital/
Instagram: https://www.instagram.com/capital_cents/
Contact: +91 9122669444
Conclusion
The September 29, 2026, Nifty 50 session provides a useful example of reviewing a pre-market trading plan against actual price movement.
The index moved below the 22,700 support area and reached an intraday low of 22,569.65. This aligned with the bearish direction of the scenario, although the extended 22,500 level was not reached. The recovery scenario towards 23,000 also remained unfulfilled.
The key takeaway is straightforward: a market analysis should be judged by its defined scenarios, actual outcomes, and risk-management framework — not by a single successful level alone.
Follow Capital Cents for regular pre-market analysis, post-market reviews, Nifty 50 technical analysis, and trading education.
Capital Cents — Analyse • Plan • Execute