- By Rahul
- November 2, 2026
- No Comments
Nifty 50 Today: Market Jumps 388 Points as Reliance Surges 11.60% | Post-Market Analysis – 2 November 2026
Nifty 50 Today: Market Jumps 388 Points as Reliance Surges 11.60% | Post-Market Analysis – 2 November 2026
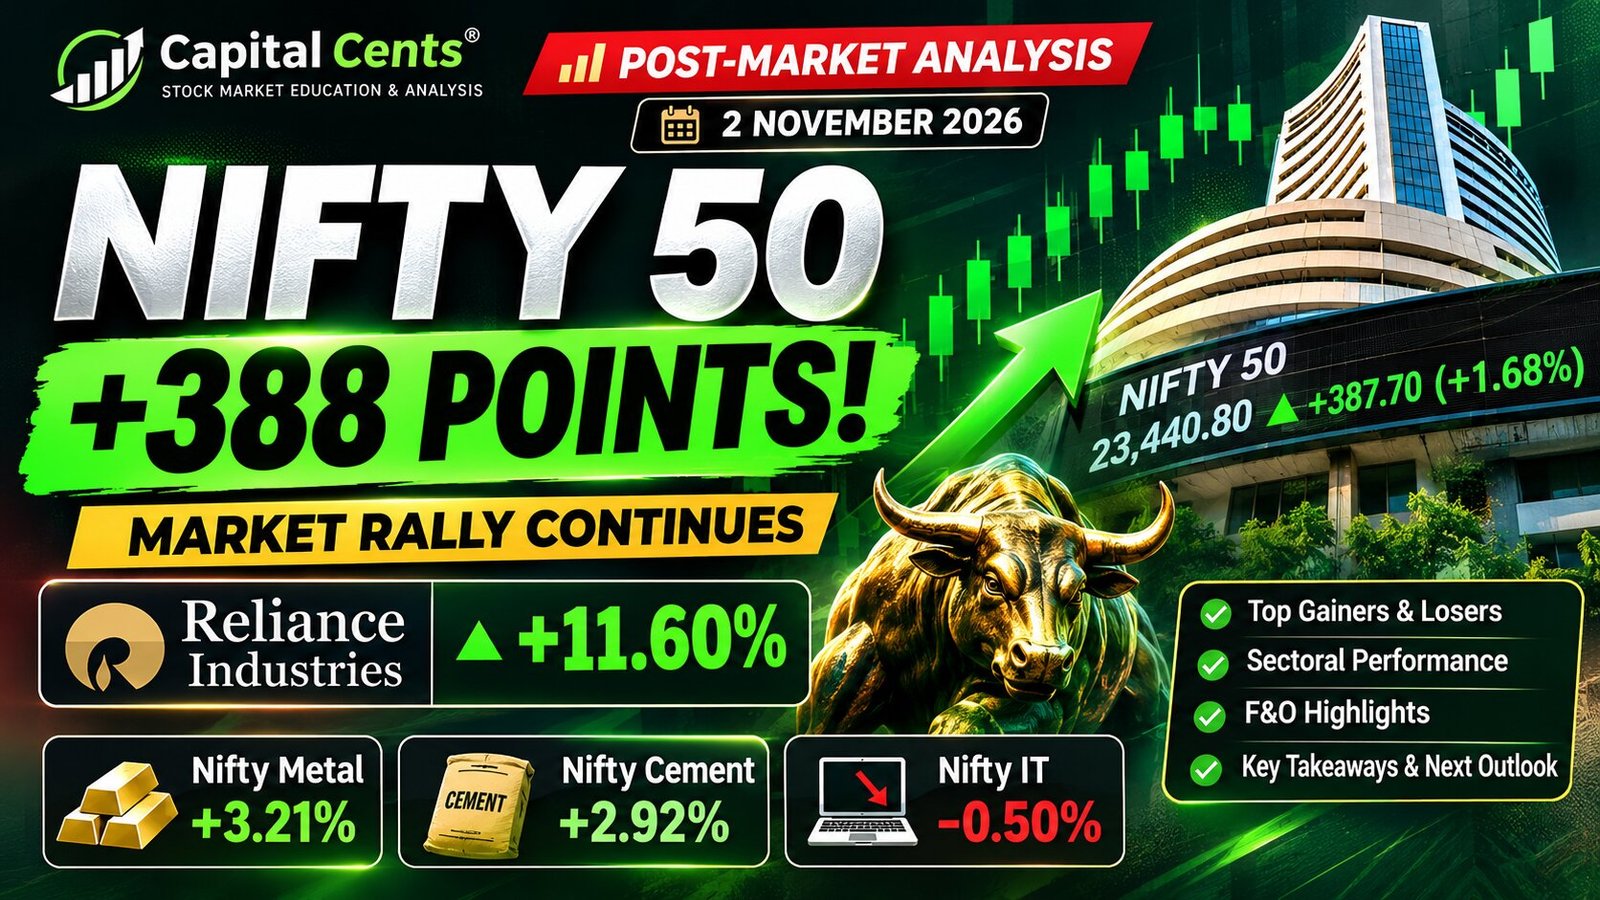
Indian Stock Market Today: The Indian stock market witnessed a strong rally on Monday, 2 November 2026, as the Nifty 50 climbed 387.70 points or 1.68% to close at 23,440.80. Reliance Industries emerged as the session’s standout performer, while Tata Steel and JSW Steel also recorded strong gains. However, Infosys remained under pressure, highlighting the mixed performance across individual stocks.
In this Capital Cents post-market analysis, we review the Nifty 50 closing performance, market breadth, top gainers and losers, sectoral trends, F&O activity and key factors traders should monitor in the next trading session.
1. Nifty 50 Today: Market Closing Summary
The benchmark Nifty 50 ended the session at 23,440.80, gaining 387.70 points or 1.68%. The index reached an intraday high of 23,440.80 after opening at 23,222.30, according to the available market report.
| Market Indicator | 2 November 2026 |
|---|---|
| Nifty 50 close | 23,440.80 |
| Point change | +387.70 |
| Percentage change | +1.68% |
| Intraday high | 23,440.80 |
| Intraday low | 23,207.05 |
| Bank Nifty snapshot | 55,002.20 |
| Bank Nifty snapshot change | +0.58% |
The session reflected strong buying interest in heavyweight stocks, particularly Reliance Industries. The broader market statistics provided for this report also showed more advancing stocks than declining stocks.
Market data should be checked against the relevant exchange’s official closing records before publication or trading decisions.
2. Market Breadth: Advances Outnumber Declines
Market breadth helps assess how widely gains or losses are distributed across the market. On the supplied market statistics dashboard, the figures were:
- Advances: 2,445 stocks
- Declines: 1,164 stocks
- Unchanged: 104 stocks
- Stocks traded: 3,713
The number of advancing stocks was more than twice the number of declining stocks. This indicates positive breadth in the displayed market statistics.
However, positive breadth alone does not guarantee that the rally will continue. Traders should also consider price structure, trading volume, sector participation and subsequent market sessions.
3. Top Gainers Today: Reliance, Tata Steel and JSW Steel
The Nifty 50 gainers list was led by Reliance Industries, followed by metal stocks. The strong moves in these companies were among the most notable developments of the session.
| Stock | Change |
|---|---|
| Reliance Industries | +11.60% |
| Tata Steel | +5.83% |
| JSW Steel | +5.13% |
| Coal India | +4.88% |
| Shriram Finance | +4.88% |
Reliance Industries leads the rally
Reliance Industries gained 11.60% in the supplied market snapshot. News coverage attributed the strong move partly to quarterly profit exceeding expectations. Given Reliance’s substantial weight in the Nifty 50, its sharp advance was an important contributor to the benchmark’s rise.
A large price move can change short-term momentum, but traders should avoid assuming that one strong session automatically establishes a sustained uptrend. Follow-up price action and fresh company disclosures remain important.
Metal stocks show strength
Tata Steel gained 5.83%, while JSW Steel advanced 5.13%. Coal India also appeared among the leading gainers.
The performance suggests that selected metal and commodity-linked stocks attracted strong buying interest. Traders can monitor whether this strength continues or whether prices begin to consolidate after the sharp advance.
4. Top Losers Today: Infosys Faces Pressure
Despite the broad rally, some Nifty 50 constituents closed lower.
| Stock | Change |
|---|---|
| Infosys | -2.03% |
| ICICI Bank | -0.76% |
| Dr. Reddy’s Laboratories | -0.74% |
| Kotak Mahindra Bank | -0.70% |
| Axis Bank | -0.66% |
Infosys was the weakest stock among the displayed losers, declining 2.03%. ICICI Bank, Dr. Reddy’s Laboratories, Kotak Mahindra Bank and Axis Bank also ended lower in the supplied snapshot.
This divergence shows why traders should assess individual stock charts rather than assuming every stock will move in line with the headline index.
5. Sectoral Market Analysis: Metals and Cement Gain
The supplied sector heatmap showed positive performance in several sectors.
| Sector Index | Change |
|---|---|
| Nifty Metal | +3.21% |
| Nifty Cement | +2.92% |
| Nifty Consumer Durables | +2.70% |
| Nifty Chemical | +1.71% |
| Nifty PSU Bank | +1.36% |
| Nifty IT | -0.50% |
| Nifty Media | -0.76% |
Metals and cement were among the stronger displayed sectors. IT and Media were weaker, showing that the rally was not uniform across the market.
Sector strength can help traders build a watchlist, but a sector’s daily percentage change should not be treated as a standalone buy or sell signal.
6. F&O Market Update: What Traders Should Observe
The supplied derivatives dashboard displayed Nifty November Futures around 23,415.30, up 1.37% at the shown timestamp. The most active call and put contracts also recorded large price changes.
Option premiums can move sharply due to changes in the underlying index, implied volatility, time decay and liquidity. A sharp rise in a call premium or fall in a put premium does not independently confirm the next session’s direction.
Before drawing conclusions from derivatives data, traders should examine:
- Open interest and changes in open interest.
- Call and put activity across relevant strikes.
- Futures basis and volume.
- Implied volatility and time remaining until expiry.
- The underlying index’s price action and important technical levels.
Important: The supplied screenshot is a timestamped snapshot, not a complete option-chain analysis. Strike-wise support and resistance levels should not be inferred from the displayed active-contract list alone.
7. What Drove the Market Rally?
Market coverage on 2 November highlighted several factors behind the rise, including stronger-than-expected quarterly earnings from Reliance Industries and a retreat in crude oil prices amid geopolitical developments.
These factors may have supported sentiment, but market movements generally reflect multiple influences. Global cues, institutional flows, company earnings and expectations about economic conditions can all affect the market.
Traders should distinguish reported news from technical interpretations and avoid attributing the entire index move to one factor without further evidence.
8. Nifty 50 Technical View: What to Watch Next
After a strong session, the next trading day may see either continuation of buying interest or some profit booking. The available closing data alone is not enough to confirm which outcome will occur.
For the next session, traders can monitor the following reference points from the supplied data:
- 23,440.80: Previous session’s closing level and displayed intraday high.
- 23,207.05: Previous session’s displayed intraday low.
- 23,222.30: Previous session’s opening level.
These are reference points from the reported session, not confirmed support or resistance levels. Their significance depends on subsequent price action, volume and the timeframe being analysed.
Bullish scenario
If the Nifty sustains above the previous session’s high and buying participation remains strong, traders may monitor whether the upward momentum continues. Confirmation should come from actual price action rather than a prediction alone.
Cautious scenario
If the index struggles near the previous high and selling pressure emerges, the market may consolidate or give back part of its gains. A break below the previous session’s range should be assessed alongside volume and other market signals.
Risk management
Avoid chasing a sharp rally without a defined plan. Position sizing, stop-loss discipline and a clear risk-to-reward framework remain important in both cash and derivatives trading.
9. Key Takeaways from the 2 November 2026 Session
- The Nifty 50 gained 387.70 points, closing at 23,440.80.
- Reliance Industries led the displayed Nifty 50 gainers with an 11.60% rise.
- Tata Steel and JSW Steel also recorded strong gains.
- Market breadth was positive in the supplied dashboard, with 2,445 advances versus 1,164 declines.
- Metal and cement indices were among the stronger displayed sectors, while IT and Media were weaker.
- The next session’s direction remains uncertain and should be assessed using fresh market data and price confirmation.
Conclusion: Indian Stock Market Post-Market Analysis
The Indian stock market ended 2 November 2026 on a strong note, with the Nifty 50 rising 1.68%. Reliance Industries was the major highlight, while Tata Steel, JSW Steel and several other stocks contributed to the positive tone. However, weakness in Infosys and selected other constituents showed that stock performance remained mixed.
For the next trading session, traders should monitor the Nifty’s reaction around the previous session’s range, sector participation, derivatives positioning and fresh market developments. A disciplined approach based on verified data is more useful than assuming that one strong session guarantees further gains.
Follow Capital Cents for daily pre-market reports, post-market analysis, technical analysis and stock market education.
Frequently Asked Questions (FAQs)
1. What was the Nifty 50 closing level on 2 November 2026?
The supplied market report shows the Nifty 50 closing at 23,440.80, up 387.70 points or 1.68%.
2. Which stock was the top gainer in the supplied Nifty 50 snapshot?
Reliance Industries led the displayed gainers with a reported rise of 11.60%.
3. Which stocks were among the top gainers today?
Reliance Industries, Tata Steel, JSW Steel, Coal India and Shriram Finance were among the gainers shown in the supplied data.
4. Which sectors performed strongly?
The supplied sector heatmap showed gains in Nifty Metal, Nifty Cement, Consumer Durables and PSU Bank.
5. Does a strong Nifty closing guarantee a bullish next session?
No. The next session depends on fresh price action, global cues, volume, institutional activity and other market conditions.
6. Where can I find daily market analysis?
You can explore Capital Cents for educational market updates, technical analysis and daily pre-market and post-market content.
Website: www.capitalcents.in
Facebook: https://www.facebook.com/centscapital/
Instagram: https://www.instagram.com/capital_cents/
Contact: +91 9122669444
Disclaimer: This article is for educational and informational purposes only and does not constitute investment advice or a recommendation to buy or sell any security or derivative. Stock market investments and trading involve risk. Figures are based on the supplied market screenshots and referenced market coverage; readers should verify relevant exchange data independently before making decisions.