- By Rahul
- October 21, 2026
- No Comments
Nifty 50 Closing Analysis, IT Stocks Rally & Key Levels – 21 October 2026
Nifty 50 Closing Analysis, IT Stocks Rally & Key Levels – 21 October 2026
The Indian stock market witnessed selling pressure on Wednesday, October 21, 2026, as the Nifty 50 closed in the red despite a strong performance from the Information Technology sector. While IT stocks provided some relief, weakness across several major sectors and declining market breadth highlighted the cautious mood among market participants.
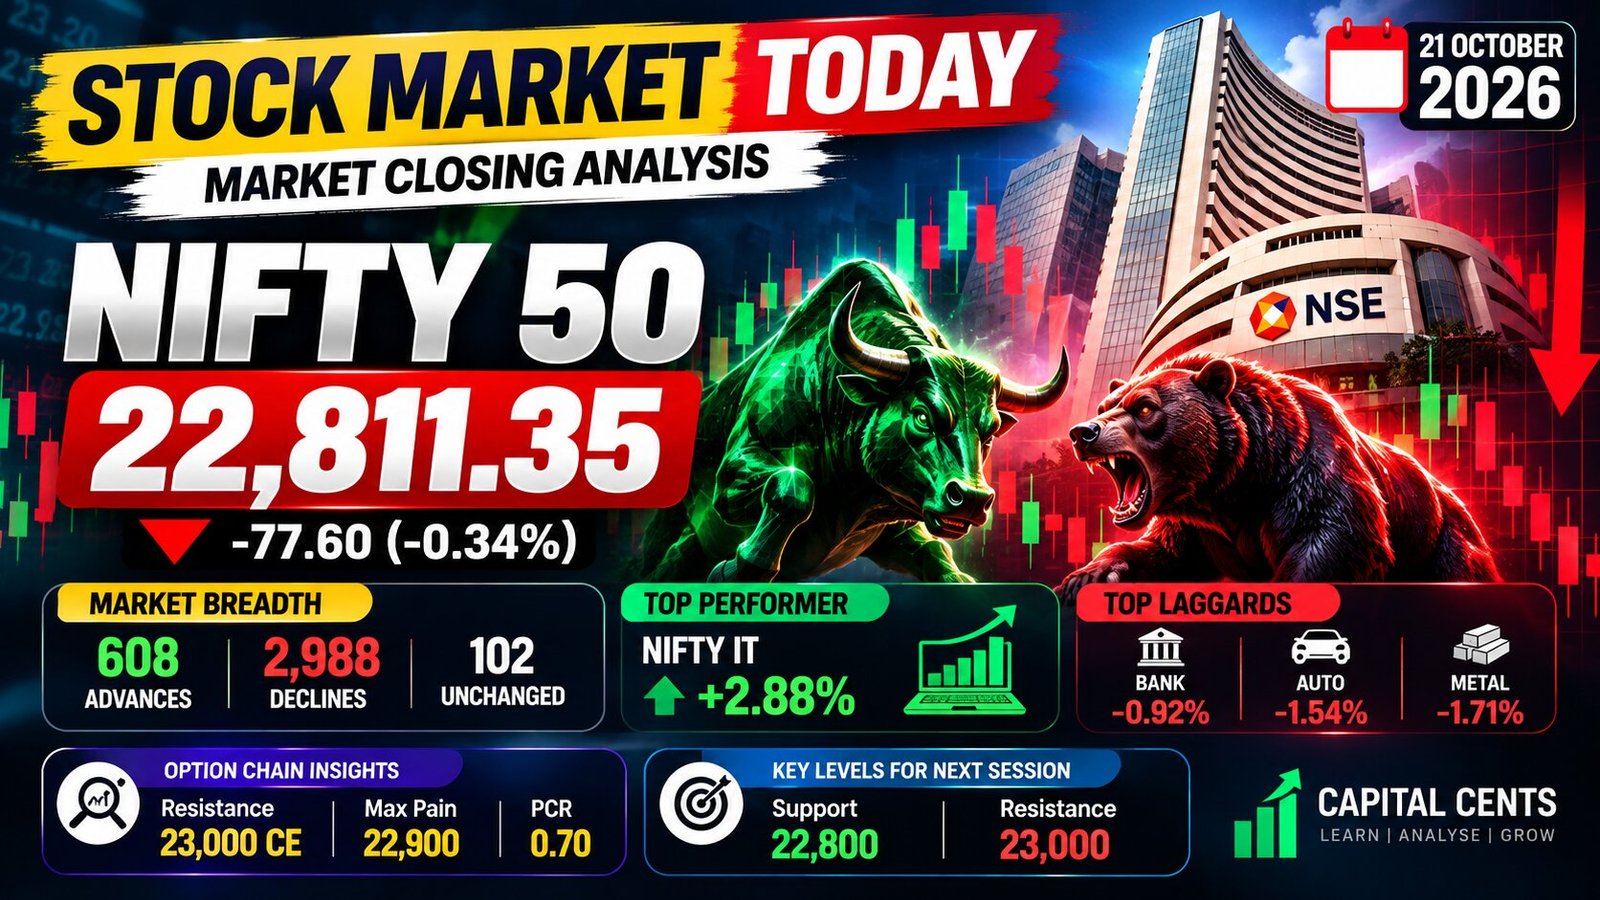
The Nifty 50 ended the session at 22,811.35, down 77.60 points or 0.34%. The index opened at 23,016 and struggled to sustain its opening levels during the session.
In this post-market analysis, we examine the Nifty 50 closing performance, market breadth, sectoral trends, option-chain data and important levels traders should watch in the next trading session.
1. Nifty 50 Closing Analysis: Selling Pressure Dominates
The Nifty 50 closed at 22,811.35 on October 21, registering a decline of 0.34% from its previous close of 22,888.95.
The index opened at 23,016, but selling pressure pushed it lower during the session. The five-minute chart provided shows a prolonged intraday decline followed by a late recovery.
However, the late-session recovery was not enough to bring the index into positive territory.
Nifty 50: Key Market Data
| Particulars | Data |
|---|---|
| Closing Price | 22,811.35 |
| Previous Close | 22,888.95 |
| Opening Price | 23,016.00 |
| Net Change | -77.60 points |
| Percentage Change | -0.34% |
| Trading Volume | 3,248.42 lakh |
| Trading Value | ₹28,920.01 crore |
What does this indicate?
The gap between the opening level and closing price indicates that the market faced selling pressure throughout much of the session. The recovery towards the end suggests that buying interest emerged at lower levels, although further price action will be needed to establish whether the recovery can continue.
Traders should avoid assuming a bullish reversal based on a late-session recovery alone.
2. Market Breadth Signals Broad-Based Weakness
One of the most important takeaways from Wednesday’s session was the weakness in overall market breadth.
According to the market statistics provided, 3,698 stocks were traded, with 608 advancing, 2,988 declining and 102 remaining unchanged.
Market Breadth on October 21, 2026
| Market Indicator | Number of Stocks |
|---|---|
| Stocks Traded | 3,698 |
| Advances | 608 |
| Declines | 2,988 |
| Unchanged | 102 |
| Stocks at 52-Week High | 44 |
| Stocks at 52-Week Low | 362 |
| Stocks in Upper Circuit | 62 |
| Stocks in Lower Circuit | 257 |
The number of declining stocks was significantly higher than the number of advancing stocks. Furthermore, 362 stocks touched their 52-week lows, compared with 44 stocks at 52-week highs.
This points to widespread weakness across the stocks covered by the market statistics, rather than a decline limited to a handful of large-cap companies.
Why is market breadth important?
Market breadth helps traders understand how widely a market move is distributed across stocks.
When an index declines and the number of falling stocks is substantially higher than the number of rising stocks, it can indicate broad selling pressure. Conversely, a recovery supported by a larger number of advancing stocks may provide stronger confirmation of improving sentiment.
Market breadth should be considered alongside price action, volume and sector performance rather than used as a standalone trading signal.
3. Sectoral Performance: IT Stocks Stand Out
Sectoral performance was mixed on October 21, with the IT sector emerging as a notable outperformer while several other sectors ended lower.
Major Sector Performance
| Sector | Change |
|---|---|
| Nifty IT | +2.88% |
| Nifty Cement | +0.47% |
| Nifty MidSmall IT | +0.92% |
| Nifty Bank | -0.92% |
| Nifty Auto | -1.54% |
| Nifty Metal | -1.71% |
| Nifty Financial Services | -1.18% |
| Nifty Realty | -1.25% |
| Nifty PSU Bank | -0.51% |
| Nifty Private Bank | -1.05% |
| Nifty Media | -1.29% |
| Nifty Consumer Durables | -1.86% |
Figures are taken from the sector-performance snapshot supplied for this analysis.
IT Sector Shows Relative Strength
The Nifty IT index gained 2.88%, making it one of the strongest performers among the sectors shown in the supplied data.
The gain indicates relative strength in IT stocks during an otherwise weak market session. However, a single session of outperformance does not establish a sustained sector uptrend.
Traders should monitor whether the IT sector can maintain its strength in subsequent sessions and whether that strength spreads to other sectors.
Banking and Other Sectors Remain Under Pressure
The Nifty Bank index declined 0.92%, while the Auto and Metal indices fell 1.54% and 1.71%, respectively.
Weakness in these sectors contributed to the mixed market picture, with IT strength failing to prevent the Nifty 50 from closing lower.
The next session’s sectoral performance may help indicate whether buying interest broadens beyond IT or remains concentrated in a limited number of sectors.
4. Nifty 50 Option Chain Analysis
The option-chain snapshot supplied for October 21 provides additional context on the levels market participants may be monitoring.
Important Option-Chain Observations
| Indicator | Reading |
|---|---|
| Nifty 50 Spot Price | 22,811.35 |
| Maximum Pain | 22,900 |
| Put-Call Ratio (PCR) | Approximately 0.70 |
| Notable Call Open Interest | 23,000 strike |
| Notable Put Open Interest | 22,000 strike |
The snapshot identifies the 23,000 Call strike as having significant open interest, making this a level worth monitoring for potential resistance.
The maximum pain level was shown at 22,900, while the displayed PCR was approximately 0.70.
What Does a PCR of 0.70 Mean?
The put-call ratio compares put open interest with call open interest when calculated using open interest.
A PCR of approximately 0.70 in the supplied snapshot indicates that call open interest was greater than put open interest under the displayed calculation. However, PCR alone cannot determine whether the market will rise or fall.
Traders should also consider changes in open interest, price movement, volume and whether positions are being added or reduced.
Important: Option-chain levels are not guaranteed support or resistance levels. They can change as market participants adjust their positions.
5. Nifty 50: Important Levels to Watch
With the Nifty 50 closing at 22,811.35, traders may focus on the nearby price zone and the 23,000 level in the next session.
Based on the supplied closing and option-chain data, the following levels are worth observing.
| Level | Significance |
|---|---|
| 23,000 | Important resistance zone to monitor |
| 22,900 | Option-chain maximum pain level |
| 22,811.35 | October 21 closing level |
| 22,800 | Nearby price-action zone |
These are observation levels, not confirmed support or resistance levels.
Bullish Scenario
If the Nifty 50 stabilises above its closing zone and buying interest strengthens, traders can watch how the index approaches 22,900 and the 23,000 resistance zone.
A sustained move above resistance, supported by stronger market breadth and price action, would provide better evidence of a potential recovery.
Bearish Scenario
If the index fails to sustain near its closing level and selling pressure returns, traders should monitor price action around 22,800.
A sustained move below this area could indicate continued weakness. Further downside levels should be assessed using updated intraday charts and market data rather than assumed in advance.
Sideways Scenario
If the index remains between nearby price levels without a decisive breakout, the market may continue consolidating.
In such conditions, traders should avoid chasing small price movements and wait for clearer confirmation.
6. What Should Traders Watch in the Next Trading Session?
The October 21 session highlights several factors that traders can monitor before making decisions in the next session.
1. Price action around 22,800
The index closed close to this round-number zone. Traders can observe whether buyers defend the area or selling pressure continues.
2. The 23,000 resistance zone
The option-chain snapshot showed notable Call open interest at 23,000. A sustained move towards or above this zone deserves attention, but open interest should be reassessed with updated data.
3. IT sector momentum
The Nifty IT index gained 2.88%. Traders should check whether this strength continues or reverses.
4. Market breadth
The large gap between advancing and declining stocks was an important warning signal. An improvement in breadth could help confirm a broader market recovery.
5. Banking stocks
The Nifty Bank index declined 0.92%. Its next-session price action may provide additional information about broader market sentiment.
6. Risk management
Traders should define their entry, exit and risk limits before taking a position. No technical indicator or option-chain reading guarantees a particular market outcome.
7. Overall Market Outlook
The Indian stock market ended October 21, 2026, on a cautious note.
The Nifty 50 declined 0.34% to close at 22,811.35, while market breadth remained weak, with 2,988 declining stocks compared with 608 advancing stocks. The IT sector’s 2.88% gain was a notable exception to the broader weakness.
For the next session, 22,800 and 23,000 are useful nearby levels to monitor, while the 22,900 maximum pain reading provides additional option-chain context.
The key question is whether the market can build on its late-session recovery and whether buying interest expands beyond IT stocks.
Traders should wait for confirmation from price action, sector performance and market breadth rather than relying on a single indicator.
Conclusion
The October 21 market session demonstrated why traders should look beyond headline index movements.
Although the Nifty 50 experienced a late-session recovery, the index still closed lower and overall market breadth remained weak. Meanwhile, IT stocks outperformed, highlighting the difference between individual sector performance and the broader market trend.
In the next trading session, monitor the 22,800 price-action zone, the 22,900 maximum pain level and the 23,000 resistance zone. Use updated market data and a disciplined risk-management approach before making trading decisions.
For more daily stock market analysis, Nifty 50 updates, technical analysis and trading education, follow Capital Cents.
Stay informed. Analyse the market. Trade with discipline.
Disclaimer: This article is for educational and informational purposes only. It is not investment advice or a recommendation to buy or sell any security or derivative. Stock market investments are subject to market risks. Please consult a qualified financial adviser before making investment decisions.