- By Rahul
- October 13, 2026
- No Comments
Nifty 50 Today: Index Jumps 358 Points | 13 October 2026
Nifty 50 Rallies 358 Points as IT Stocks Lead Gains | 13 October 2026
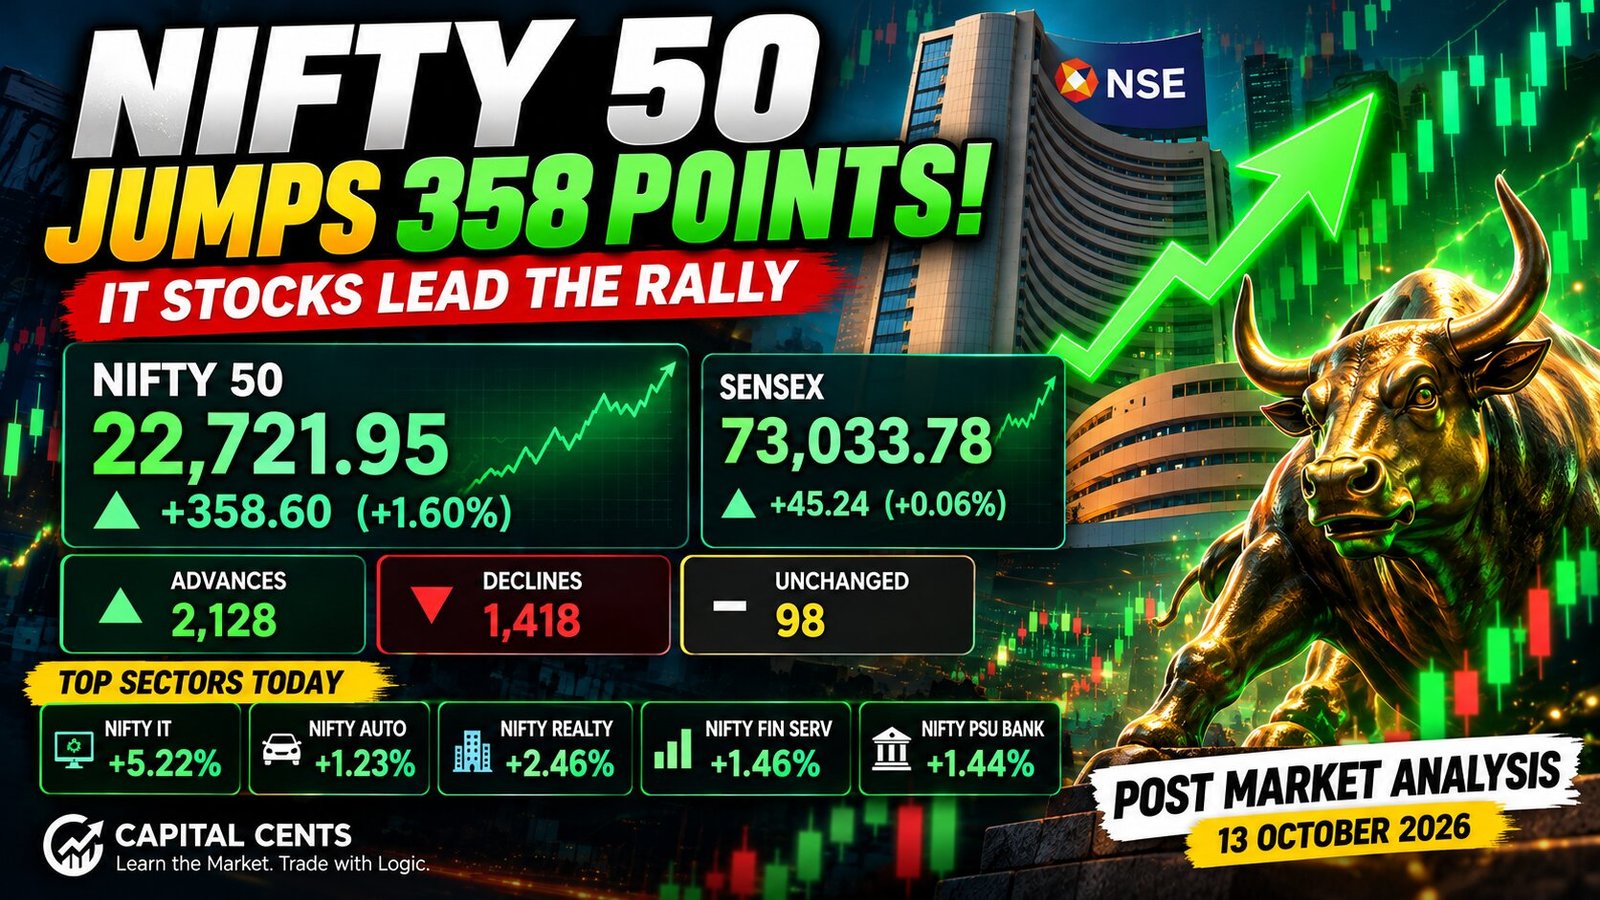
The Indian stock market witnessed a strong bullish session on Tuesday, 13 October 2026, with the Nifty 50 climbing 358.60 points, or 1.60%, to close at 22,721.95. Buying interest across major sectors, particularly information technology, supported the broader market rally.
The Nifty IT index emerged as a standout performer, gaining approximately 5.22%. Auto, Realty, Financial Services and PSU Bank stocks also traded in positive territory, reflecting broad participation in the session’s advance.
However, traders should monitor whether the market can sustain its upward momentum in the next trading session, especially near important resistance zones.
1. Nifty 50 Today: Market Highlights
The benchmark Nifty 50 closed at 22,721.95, compared with its previous close of 22,363.35. The index opened at 22,364.15 and gained 358.60 points during the session.
| Market Indicator | Data |
|---|---|
| Nifty 50 Closing Level | 22,721.95 |
| Previous Close | 22,363.35 |
| Opening Level | 22,364.15 |
| Point Gain | 358.60 |
| Percentage Gain | 1.60% |
| Nifty 50 P/E | 19.12 |
| Nifty 50 P/B | 2.75 |
The advance indicates strong buying interest during the session. The index moved higher from the opening area and displayed a sharp upward trend in the afternoon.
2. Market Breadth: Advances Outnumber Declines
Market breadth remained positive on the available market statistics.
- Stocks traded: 3,644
- Advances: 2,128
- Declines: 1,418
- Unchanged: 98
- Stocks at 52-week highs: 71
- Stocks at 52-week lows: 159
Advancing stocks outnumbered declining stocks, indicating that the rally extended beyond a small number of index constituents.
However, the number of stocks at 52-week lows remained higher than the number at 52-week highs. This suggests that the overall market picture may be more mixed than the strong benchmark index performance alone indicates.
3. Sectoral Performance: Nifty IT Leads the Rally
Information technology stocks were among the strongest performers on 13 October 2026. Several other sectoral indices also recorded gains.
| Sectoral Index | Change |
|---|---|
| Nifty IT | +5.22% |
| Nifty Realty | +2.46% |
| Nifty Financial Services | +1.46% |
| Nifty PSU Bank | +1.44% |
| Nifty Auto | +1.23% |
| Nifty Metal | +1.15% |
| Nifty Bank | +1.03% |
| Nifty Private Bank | +0.74% |
| Nifty Pharma | -0.01% |
| Nifty MidSmall Healthcare | -0.19% |
The strong performance in IT stocks was a key feature of the session. Realty, Auto and Financial Services also contributed to the positive market tone.
The Nifty Bank index closed at 55,481.05, up approximately 1.03% according to the supplied sector snapshot.
Sectoral performance can change quickly, so traders should confirm the latest price action before making decisions.
4. Top Nifty 50 Gainers Today
The following stocks featured among the leading Nifty 50 gainers in the supplied market data.
| Stock | Closing Price | Change | % Change |
|---|---|---|---|
| HCL Technologies | ₹1,326.00 | +₹103.00 | +8.42% |
| TCS | ₹2,269.30 | +₹144.30 | +6.79% |
| Shriram Finance | ₹988.00 | +₹58.60 | +6.31% |
| Tech Mahindra | ₹1,543.50 | +₹72.50 | +4.93% |
| Infosys | ₹1,062.10 | +₹42.10 | +4.13% |
IT stocks dominated the gainers list, with HCL Technologies and TCS recording particularly strong advances.
The performance of these stocks highlights the importance of tracking sectoral momentum alongside individual stock price action.
5. Nifty 50 Technical Analysis: Important Levels to Watch
The supplied five-minute Nifty 50 chart showed a strong upward move during the session. Price moved above the 11-period exponential moving average (EMA), which was displayed near 22,681.77.
The price trading above the EMA suggests that short-term intraday momentum was bullish at the time captured in the chart. However, an EMA is a trend indicator, not a guarantee of continued price appreciation.
Immediate Support Zone
22,680–22,700
This is a near-term reference zone based on the displayed EMA and recent price action. Traders can monitor whether the index holds this area during any pullback.
A sustained move below this zone could indicate weakening short-term momentum and increase the possibility of further profit booking.
Immediate Resistance Zone
22,750
The 22,750 area is a nearby reference level to watch. A sustained move above it, supported by price action and market breadth, could indicate the possibility of further upside.
A rejection near this level could lead to consolidation or a pullback.
These levels are derived from the supplied chart and are not independently verified live-market levels. They should be reassessed using the next session’s opening price and updated charts.
6. Nifty Bank Analysis
The Nifty Bank index closed at 55,481.05, up 15.40 points in the displayed five-minute chart snapshot. The broader sector dashboard showed the banking index higher by approximately 1.03%.
The intraday chart showed a sharp upward move followed by consolidation near the session’s higher levels.
For the next session, traders can observe whether the index sustains above its recent breakout area or moves into profit booking. Confirmation from leading banking stocks and the broader market would be important before drawing a stronger directional conclusion.
7. Nifty 50 Outlook for 14 October 2026
Following the strong advance on 13 October, the next session will be important for assessing whether bullish momentum can continue.
Bullish Scenario
If Nifty 50 sustains above the 22,750 reference area and buying interest remains broad-based, traders can monitor the possibility of further upward movement.
Consolidation Scenario
If the index struggles near resistance, it may move sideways as traders reassess positions after the sharp rally.
Bearish or Profit-Booking Scenario
If the index falls below the 22,680–22,700 reference zone and fails to recover it, short-term momentum could weaken. Traders should monitor price action rather than assume that a pullback will automatically become a reversal.
These are conditional scenarios, not predictions or guaranteed trading signals.
8. What Should Traders Watch Tomorrow?
Before taking a trade on 14 October 2026, traders should monitor:
- Nifty 50’s opening price and the first 15–30 minutes of price action.
- Whether the index sustains above or below the 22,750 resistance reference.
- Price behaviour around the 22,680–22,700 support reference.
- Nifty IT and banking stocks for continued sectoral strength.
- Market breadth to determine whether the rally remains broad-based.
- Price and volume confirmation before entering a trade.
Avoid chasing a sharp opening move without a predefined stop-loss, suitable position sizing and a clear trading setup.
Website: www.capitalcents.in
Facebook: https://www.facebook.com/centscapital/
Instagram: https://www.instagram.com/capital_cents/
Contact: +91 9122669444
Conclusion
The Indian stock market ended 13 October 2026 on a strong note, with Nifty 50 gaining 1.60% to close at 22,721.95. IT stocks led the rally, while Auto, Realty and Financial Services also recorded gains.
The index’s position above its displayed short-term EMA supported the bullish intraday picture. Going into the next session, 22,750 is a key nearby resistance reference, while 22,680–22,700 is an important support area to monitor.
The next session’s price action will help determine whether the rally continues or the market enters a consolidation phase.
Follow Capital Cents for daily pre-market reports, post-market analysis and stock market education.
Disclaimer: This article is for educational and informational purposes only. It does not constitute investment advice, a recommendation to buy or sell securities, or a promise of returns. Market levels are based on the supplied chart snapshots and may change. Please conduct your own research and consult an appropriately registered professional where necessary.