- By Rahul
- September 30, 2026
- No Comments
Nifty Prediction vs Actual Market on 30 September 2026: Nifty 50, Bank Nifty & Market Analysis
Nifty Prediction vs Actual Market on 30 September 2026: Nifty 50, Bank Nifty & Market Analysis
The Indian stock market ended the trading session on 30 September 2026 with mixed performance across major indices. The Nifty 50 closed in the red, while Bank Nifty finished higher, highlighting the two indices’ divergent performance.
In this post-market analysis, Capital Cents reviews the morning’s key Nifty levels against the actual closing data, examines market breadth, and highlights the major gainers, losers, and sectoral trends of the session.
1. Nifty 50 Closing Analysis: What Actually Happened?
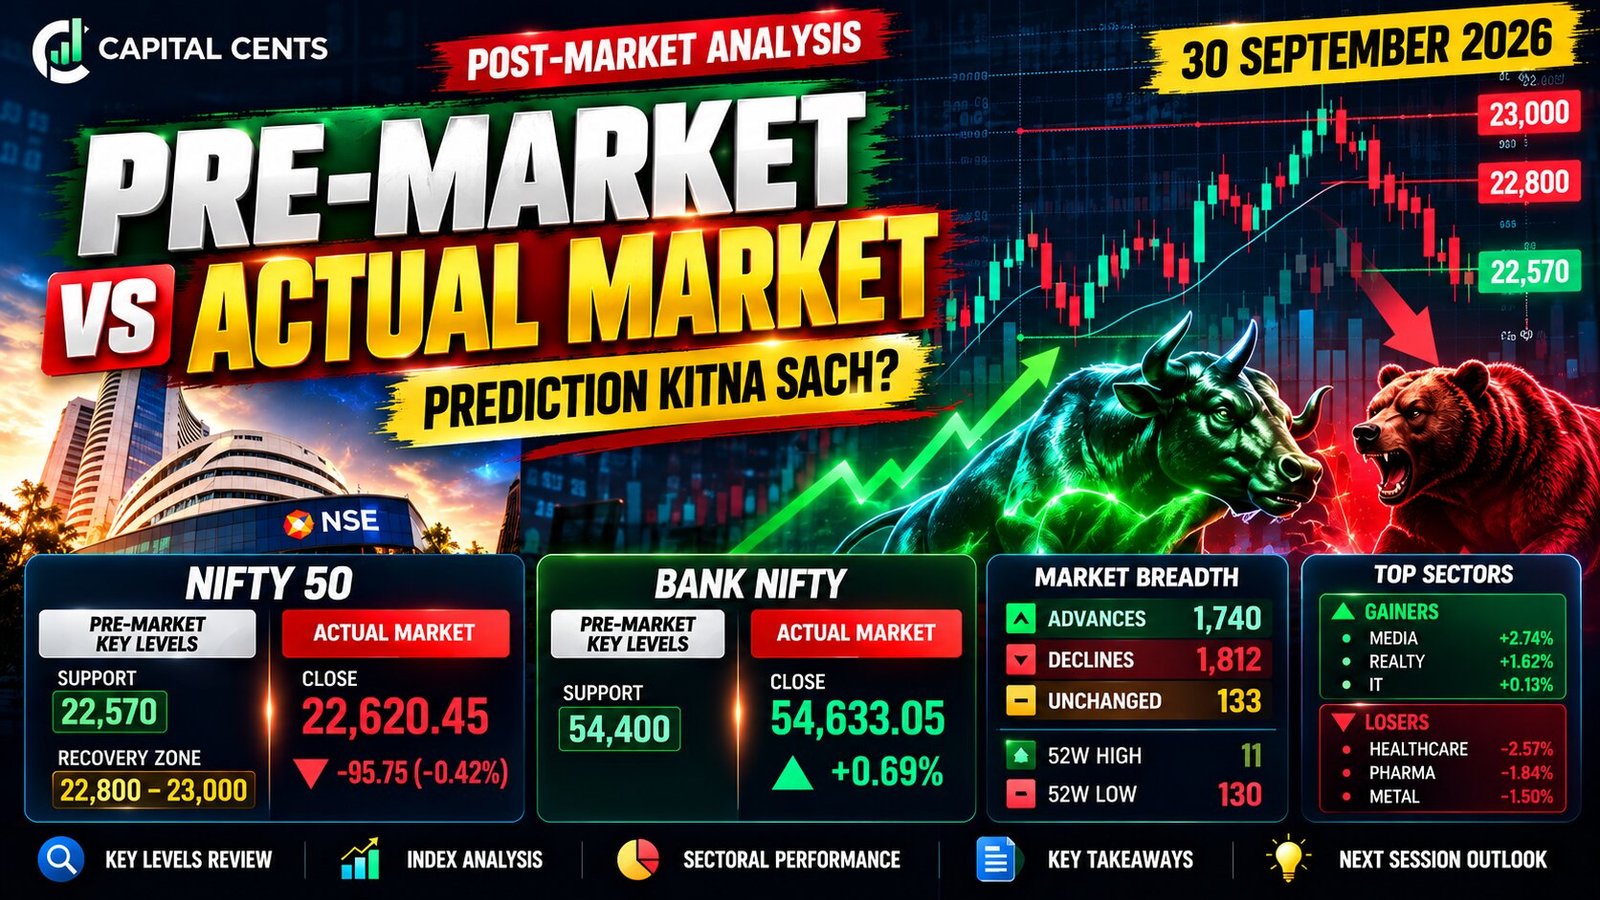
The Nifty 50 opened at 22,665.00 and closed at 22,620.45, recording a decline of 95.75 points from the previous close of 22,716.20.
The index attempted to recover during the session but subsequently weakened. The closing data indicates that buyers were unable to sustain a recovery sufficient to bring the index back to its previous closing level.
For traders following technical analysis, the session highlights why intraday price action and closing confirmation need to be evaluated separately.
2. Pre-Market Prediction vs Actual Market
Before the market opened, our analysis focused on the 22,570 support reference and the 22,800–23,000 recovery zone.
The actual closing data provides the following comparison.
Parameter | Pre-market reference | Actual outcome |
|---|---|---|
Nifty support | 22,570 | Closed at 22,620.45 |
Recovery zone | 22,800–23,000 | Recovery attempt near the lower boundary, but no sustained move towards 23,000 |
Closing direction | Recovery scenario under observation | Nifty closed 0.42% lower |
Market confirmation | Price reaction awaited | Closing remained below the recovery zone |
What worked, and what did not?
Support reference: Nifty closed 50.45 points above the 22,570 reference level. However, a close above a support level alone does not confirm that the level held throughout the entire session.
Recovery scenario: The index approached the 22,800 area, but the market did not sustain a recovery towards 23,000.
Directional outcome: Nifty ended lower compared with its previous close. Therefore, the bullish recovery scenario did not materialise as a sustained closing move.
The takeaway is straightforward: identifying important levels is only one part of market analysis. Traders also need to evaluate price behaviour, momentum, and confirmation around those levels.
3. Bank Nifty Analysis: A Different Market Picture
While Nifty 50 declined, Bank Nifty closed at 54,633.05, gaining approximately 0.69% on the day.
This divergence is an important feature of the session. It shows that the banking index demonstrated relative strength compared with the broader benchmark, even as Nifty remained under pressure.
Traders analysing index futures and options can use this difference as a reason to examine the indices separately rather than assuming they will always move in the same direction.
However, a single session of outperformance does not automatically confirm a continuing bullish trend.
4. Market Breadth: Were More Stocks Advancing or Declining?
The market statistics at the close showed the following numbers:
Declining stocks outnumbered advancing stocks by 72. This indicates slightly negative market breadth, consistent with the weakness seen in Nifty 50.
The statistics also showed 130 stocks at their 52-week lows compared with 11 stocks at their 52-week highs. These figures provide additional context about the distribution of stock performance during the session.
Market breadth is a useful supporting indicator, but it should be interpreted alongside price action, sector performance, and trading volume.
5. Sectoral Market Performance
The sectoral index snapshot also showed mixed performance across industries.
Sectoral index | Change shown |
|---|---|
Nifty Media | +2.74% |
Nifty Realty | +1.62% |
Nifty IT | +0.13% |
Nifty Metal | −1.50% |
Nifty Pharma | −1.84% |
Nifty Healthcare | −2.57% |
Media and realty indices were among the stronger performers in the displayed snapshot, while healthcare, pharma, and metal indices recorded declines.
This sector-level divergence adds another layer to the pre-market versus actual market review. Even when the headline index is weak, selected sectors may show relative strength.
For a more complete trading assessment, sector performance should be combined with index structure, volume, and relevant news rather than used as a standalone buy or sell signal.
6. What Should Traders Learn From This Session?
The 30 September session offers several practical lessons for technical analysis.
1. Treat support and resistance as reference zones. A price level helps organise a trading plan, but a level is not a guarantee that price will reverse.
2. Look for confirmation. A recovery attempt near resistance is different from a sustained breakout above it. Closing position and subsequent price action both matter.
3. Compare indices independently. Nifty 50 declined while Bank Nifty advanced. This difference can matter when evaluating market participation and relative strength.
4. Monitor market breadth. More declining stocks than advancing stocks can indicate underlying weakness, even when selected stocks or sectors rise.
5. Define risk before entering a trade. Stops, position sizing, and predefined exit conditions are essential parts of a trading plan. No market prediction guarantees a profitable outcome.
7. Capital Cents: Pre-Market vs Actual Market Review
At Capital Cents, our objective with this series is to compare the levels discussed before the market opens with what actually happens during the trading session.
For 30 September 2026, the review can be summarised as follows:
Nifty 50 closed at 22,620.45, down 0.42%.
The 22,570 support reference remained below the closing price, but this alone does not confirm an intraday support hold.
The index approached the 22,800 recovery area but did not sustain a move towards 23,000.
Bank Nifty closed higher at 54,633.05, showing relative strength against Nifty 50.
Market breadth was slightly negative, with 1,812 declines against 1,740 advances.
The purpose of this review is not to claim perfect prediction accuracy. It is to evaluate the original analysis against actual data, identify where the market behaved differently from the expected scenario, and improve the process for future sessions.
Website: www.capitalcents.in
Facebook: https://www.facebook.com/centscapital/
Instagram: https://www.instagram.com/capital_cents/
Contact: +91 9122669444
Conclusion: What Did the Market Teach Us?
The Indian stock market ended 30 September 2026 with mixed index performance. Nifty 50 remained under pressure, Bank Nifty gained, and broader market breadth leaned slightly negative.
Our pre-market versus actual review highlights an important distinction: a support reference can remain relevant without producing a sustained recovery, and a price approaching resistance does not automatically confirm a breakout.
For traders and investors, the focus should remain on disciplined analysis, price confirmation, risk management, and reviewing decisions against actual market behaviour.
What is your view for the next session — a Nifty recovery or continued selling pressure? Share your analysis in the comments.